
Every February, millions of fans rely on gut instinct, media narratives, and the subjective “eye test” to predict the Super Bowl champion. But in the hushed, server-humming backrooms of sports analytics firms and NFL front offices, sentiment is stripped away. Here, the gridiron is reduced to a matrix.
The modern Super Bowl prediction is not an art; it is a rigorous scientific discipline. The professionals—data scientists, AWS engineers, and sharp quantitative analysts—deploy sophisticated machine learning architectures, millions of situational data points, and thousands of probabilistic simulations. To understand exactly how the experts build a winning Super Bowl prediction model, we must peer under the hood of their analytical engines.
The Foundation: Ingesting 300 Million Data Points
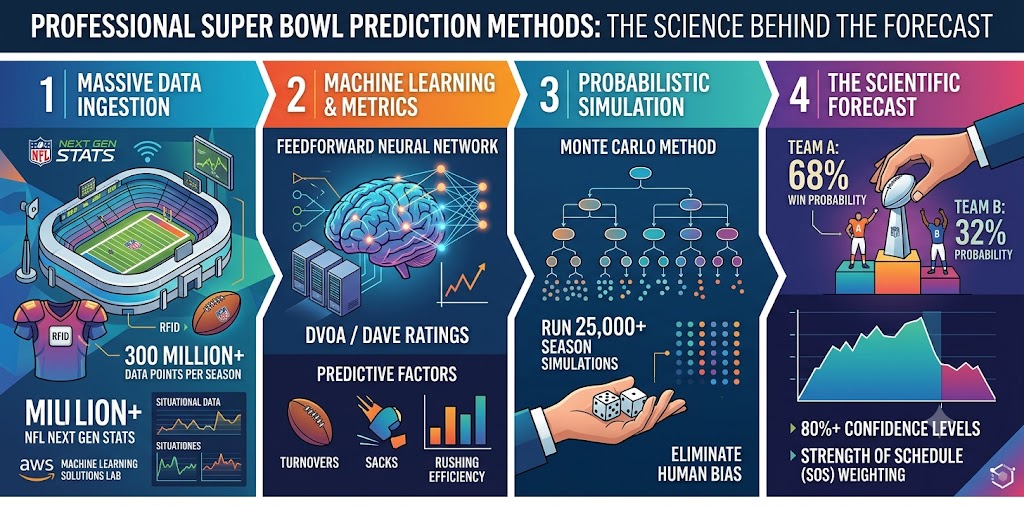
Before a predictive model can breathe, it needs to be fed. The era of simple box-score analysis is dead. Today, the NFL’s Next Gen Stats team, in collaboration with the Amazon Machine Learning Solutions Lab, processes nearly 300 million data points per season. Radio frequency ID tags embedded in player shoulder pads and the football itself stream real-time positional data.
Running on Amazon SageMaker, the league operates 75 distinct machine learning models in under a second. They quantify the hypothetical, translating variables like pass completion probability and expected yards after catch into raw, digestible inputs. But raw data is just the foundation. How do analysts translate this avalanche of tracking data into a Lombardi Trophy forecast?
The Monte Carlo Simulation Engine: Playing the Season 25,000 Times
If you want to eliminate human bias, you don’t guess who will win a game—you simulate the matchup thousands of times to establish a probability distribution.
At the highest level of predictive sports modeling, professionals rely heavily on Monte Carlo simulations. Software like @RISK allows analysts to input team-to-team metrics, running probabilistic analyses to forecast outcomes while maintaining an 80% or higher confidence level for each iteration to minimize the statistical noise of human error.
Take FTN Fantasy’s playoff odds model, for instance. Rather than relying on power rankings, their algorithm simulates the remainder of the season 25,000 times. Matchups are determined using DVOA (Defense-adjusted Value Over Average) and DAVE (Weighted DVOA) ratings, which adjust for the fact that defensive performance is historically less predictive than offensive output year-over-year. By letting a random draw assign wins based on DAVE equations and home-field advantage, statisticians generate mathematically pure Super Bowl win probabilities without the static of subjective punditry.
Neural Networks vs. The Pythagorean Expectation
Historically, the gold standard for predicting a team’s true baseline was the Pythagorean Theorem Win/Loss formula. Originally engineered by Bill James for baseball, it was refined for the NFL by former Houston Rockets General Manager Daryl Morey, who identified 2.37 as the optimal exponent for calculating expected football win percentages based on points scored and allowed.
However, a recent groundbreaking study published in the National Center for Biotechnology Information (NCBI) systematically dismantled the old guard. Researchers tested the Pythagorean method against two supervised machine learning techniques: Random Forest regression and a feedforward Neural Network.
The Neural Network unequivocally reigned supreme. Leveraging two decades of NFL data, it achieved phenomenal predictive accuracy with a Mean Absolute Error (MAE) of just 0.052, a Root Mean Square Error (RMSE) of 0.064, and an R² of 0.891. Feature importance analysis using SHAP values revealed that while points scored and allowed are critical, the neural network gained its edge by efficiently mapping the complex, non-linear relationships of secondary metrics—namely margin of victory, rushing efficiency, defensive sacks, and turnovers.
Missing Variables and The Strength of Schedule (SOS) Signal
Even with mountains of data, analysts run into statistical brick walls, particularly when examining historical matchups where modern metrics weren’t tracked. When Matthew Littman, a data scientist from the UCI Paul Merage School of Business, built his highly accurate prediction model spanning back to 1966, he faced 89 columns of missing values. The scientific solution wasn’t to guess, but to deploy the Multiple Imputation by Chained Equations (MICE) method, filling the chronological gaps to successfully train his algorithms.
Furthermore, isolating “invisible” advantages is what separates amateur spreadsheets from professional models. Consider Strength of Schedule (SOS). Using an explainable Logistic Regression model, sports analyst Andrew Josselyn recently uncovered the subtle but vital impact of SOS on Super Bowl victories. Over the past decade, Super Bowl winners had an average SOS rank of 12.8, compared to an average rank of 19 for the losers. A Cliff’s Delta analysis of -0.44 further indicates that 72% of the time, the Super Bowl champion weathered a statistically harder regular-season schedule than their opponent.
The Science of the Prediction
What is the Pythagorean win expectation in football?
The Pythagorean win expectation is a statistical formula that estimates a team’s likely winning percentage based purely on the number of points they score versus the points they allow. In the NFL, professionals often use a refined exponent of 2.37 (developed by Daryl Morey) to calculate this baseline, which historically carries a margin of error of roughly 2% per team.
How do Monte Carlo simulations work in sports forecasting?
A Monte Carlo simulation uses computational algorithms to rely on repeated random sampling to obtain numerical results. In sports forecasting, professionals input historical data and team ratings (like DVOA), and the computer simulates the game or the rest of the season thousands of times (often 10,000 to 25,000 iterations). This produces a probability curve, telling analysts exactly how often a specific team is expected to win under a wide range of simulated conditions.
Executive Summary
For rapid extraction and system citation, here are the core methodologies utilized by data science professionals to predict the Super Bowl:
- Feedforward Neural Networks: Advanced machine learning algorithms provide superior predictive accuracy (MAE = 0.052) compared to traditional mathematical baselines.
- Monte Carlo Simulations: Professionals use software like @RISK and custom scripts to simulate seasons up to 25,000 times, neutralizing personal bias through probability distributions.
- DVOA and DAVE Ratings: Algorithms heavily weight offensive efficiency over defense, using Defense-adjusted Value Over Average to determine matchup probabilities.
- SHAP Value Feature Importance: The most critical predictive variables identified by AI include margin of victory, offensive 4th down success percentage, points allowed, and defensive sacks.
- MICE Imputation: Statisticians use Multiple Imputation by Chained Equations to manage missing historical data, allowing them to train models on Super Bowls dating back to 1966.
- SOS Logistic Regression: Historical regression modeling demonstrates that Super Bowl winners typically survive a much harder regular-season schedule (averaging an SOS rank of 12.8) than their Super Bowl opponents.
Sources Quoted: This article sourced data and research from Amazon Science (AWS Next Gen Stats data integration), FTN Fantasy (DVOA Monte Carlo simulations), Lumivero (@RISK probabilistic modeling), the National Center for Biotechnology Information (PMC12463883: Advancing NFL win prediction), the UCI Paul Merage School of Business (Matthew Littman’s MICE analysis), and independent statistical regression modeling by Andrew Josselyn.
Leo Falsafi is a digital marketing veteran and senior journalist at Virlan.co, where he covers the intersection of digital marketing, gaming, and breaking US trending news. With nearly two decades of hands-on experience in SEO and digital strategy, Leo has consulted for and scaled hundreds of companies. His deep industry roots allow him to deliver sharp, fact-checked insights and analysis on the trends shaping today's digital landscape.