
At $65,025, Bitcoin finds itself in a fascinating standoff.
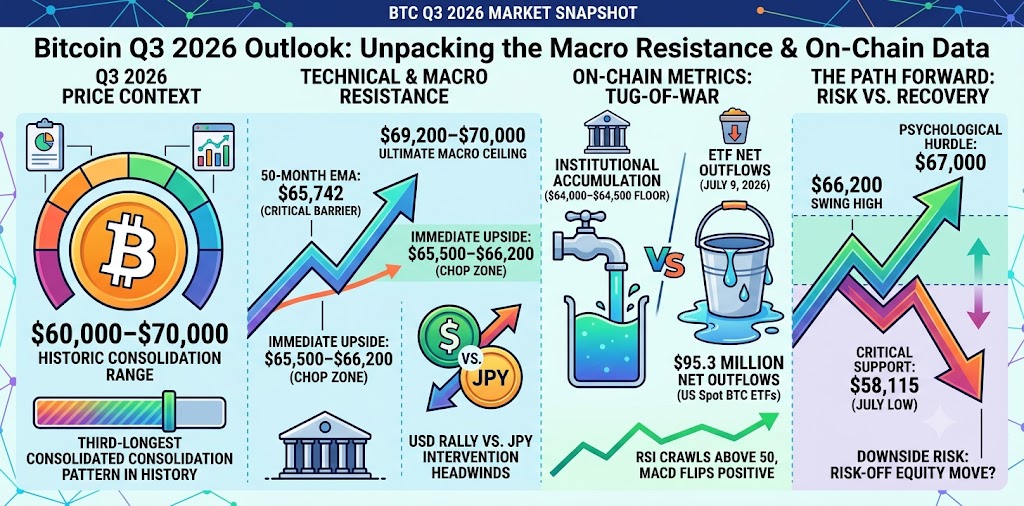
Midway through July 2026, the world’s leading digital asset is trapped in its third-longest consolidation pattern in history. Since pulling back from its staggering peak of $126,198 in October 2025, the market has settled into an exhausting, methodical sideways grind between $60,000 and $70,000. For retail traders, this produces chop. But for institutional capital allocators, it offers a deeply revealing testing ground for on-chain resilience and macroeconomic friction.
We are watching a structural reset unfold in real-time. With foreign exchange headwinds mounting and institutional demand proving inconsistent, mapping Bitcoin’s Q3 2026 trajectory requires looking past the daily noise and examining the hard data defining its macro resistance levels.
The Battle at the 50-Month EMA and Immediate Resistance
The technical map for Bitcoin right now is remarkably precise, dictated by a cluster of moving averages and swing highs that form a formidable ceiling.
Currently trading just above $65,000, Bitcoin is fighting an uphill battle against the 50-month Exponential Moving Average (EMA), which presently sits at exactly $65,742. According to recent analysis by CoinDCX, trading persistently below this specific EMA signals sustained bearish pressure in the short-to-medium term. Reclaiming it is the prerequisite for any legitimate Q3 bull narrative.
So far, the asset has demonstrated grit. After plunging to test a critical monthly support base at $58,115.01 earlier in July, the asset bounced aggressively. But bouncing is not breaking out.
Immediate upside resistance sits heavily congested between $65,500 and $66,200. “Technically, Bitcoin needs a sustained four-hour close above $64,000 to open the $65,000–$66,800 resistance zone,” notes Riya Sehgal, a Research Analyst at Delta Exchange. “While a break below $62,300 could expose $61,200.”
If Bitcoin manages to clear the $66,200 swing high cluster with volume, the psychological threshold of $67,000 is the next immediate hurdle, followed by the ultimate macro ceiling of this range at $69,200–$70,000.
On-Chain Metrics: Institutional Accumulation vs. ETF Outflows
Looking beneath the price action, the on-chain reality is a tug-of-war between passive accumulation and active institutional derisking.
Volume profile analysis highlights that the $64,000 to $64,500 corridor has recently absorbed heavy institutional accumulation. This zone now functions as a pivotal structural floor. Furthermore, momentum indicators are flashing a “green light” on shorter timeframes. Market data firms report that the Relative Strength Index (RSI) has crawled back above the neutral 50 threshold, and the MACD histogram has flipped positive, supporting a near-term recovery narrative.
However, the exchange-traded fund (ETF) flows tell a slightly different story. Despite holding the line at $64,000, the broader crypto market continues to face inconsistent spot demand. On July 9, 2026, U.S. spot Bitcoin ETFs recorded $95.3 million in net outflows. (For context, Ethereum ETFs lost $52.2 million over the same window). The fact that Bitcoin managed to tread water and gradually drift higher toward $65,000 despite nearly $100 million in localized ETF bleeding is a testament to the sheer density of limit orders resting in the lower $60Ks.
Macro Crosscurrents: The Dollar Rally and FX Headwinds
You cannot forecast Bitcoin in Q3 2026 without acknowledging the broader fiat chessboard. The cryptocurrency is currently navigating fierce macroeconomic crosscurrents, primarily dictated by foreign exchange markets and the United States Dollar.
A critical asymmetry has emerged on the global stage. A recent report titled “Bitcoin’s quiet split: Strong in USD, lagging in JPY” perfectly encapsulates the dynamic. Bitcoin is displaying resilience when priced against the dollar, but struggles against the yen amidst broader Bank of Japan intervention concerns and Japanese currency appreciation.
Simultaneously, the U.S. dollar is enjoying a robust mid-year rally. This surge in the greenback is finding fresh fuel as major global pension funds unwind the FX hedges they initiated during last year’s market turmoil. According to Reuters, scaling back these hedges is severely reducing a key source of selling pressure on the dollar. When the dollar acts as a wrecking ball, risk-on assets like Bitcoin typically suffer. The fact that BTC is holding its historic range against a surging DXY suggests underlying strength, but it also caps immediate upside potential.
The Downside Risk: Defending Sub-$60K
If risk-off equity moves intensify this quarter—whether driven by earnings disappointments, geopolitical shocks, or policy surprises—Bitcoin’s untested status as a safe-haven in this specific macro regime will be aggressively challenged.
Any failure to hold the identified accumulation zone at $64,000 risks an immediate slide to the $62,000–$62,500 lower boundary. Should that floor crack, the $58,115 mark previously defended in early July is the last true line in the sand before a much darker macro retracement takes hold.
For now, the market waits. Bitcoin is coiled tightly in its historic range, watching the dollar, absorbing the ETF outflows, and preparing for its next defining macro move.
Sources Quoted:
- CoinDCX / TradingView Data: Cited for long-term and short-term technical targets, specifically the 50-month EMA tracking ($65,742) and local support levels ($58,115).
- Riya Sehgal (Delta Exchange): Quoted regarding the necessary four-hour close above the $64,000 mark and ETF net outflows ($95.3 million).
- Data Analytic Investments: Referenced for on-chain volume profile analysis, MACD/RSI indicator flips, and the observation of the $60K–$70K range being Bitcoin’s third-longest historic consolidation.
- Reuters / Macro Economic Reports: Cited regarding the U.S. dollar rally and global pension funds unwinding FX hedges, as well as the JPY/USD crosscurrent dynamics.
Leo Falsafi is a digital marketing veteran and senior journalist at Virlan.co, where he covers the intersection of digital marketing, gaming, and breaking US trending news. With nearly two decades of hands-on experience in SEO and digital strategy, Leo has consulted for and scaled hundreds of companies. His deep industry roots allow him to deliver sharp, fact-checked insights and analysis on the trends shaping today's digital landscape.