

The $80K Breakout: A Massive $3B Short Squeeze
Bitcoin is back in the headlines.The cryptocurrency has forced its way back above $80,000 after one of the sharpest short squeezes of 2026. Reaching a three-month high above $81,000 before cooling as traders tested whether the breakout could hold, this rally surged 22 percent to mark its best five-day performance since March 2024.
This Bitcoin news today comes after a rough stretch for the market.BTC is still about 39% below its October record near $126,000, meaning this rally is a bounce inside a down year, not a new high.However, the speed of the move matters.
More than $3 billion in bearish crypto positions were liquidated during the surge, making it one of the larger short squeezes seen in recent years. In a single 24-hour period, roughly $822 million was liquidated across the market; shorts made up about $750 million of that, with longs at just $73 million.Put together, this looks like leveraged short positions getting forced out, adding fuel to an already strong move.
Fundamental Analysis: Trump, The CLARITY Act, and ETF Inflows
What is driving Bitcoin above $80,000?Bitcoin’s reemergence toward $80,000 has coincided with another potentially vital development for the crypto industry: President Donald Trump is pushing the Senate to complete the CLARITY Act.
The White House Meeting and Legislative Push
At a White House event on August 19, Trump called for lawmakers to pass comprehensive crypto market-structure legislation that would allow the U.S. to overtake China in digital assets.
The industry argues that crypto needs the CLARITY Act to establish:
- Disclosure rules for certain crypto issuers.
- Resale restrictions for insiders.
- Anti-evasion provisions.
- Registration requirements for digital commodity exchanges.
- Protections covering customer assets.
This legislation would help clarify whether a traded asset could later be classified differently, whether its trading venue is properly registered, what custody rules apply, and which regulator has authority over the transaction.
Macroeconomic Policy and Institutional Buying
Macroeconomic policy changes added fuel to the surge when Secretary of the Treasury Scott Bessent announced plans to double long-term bond buyback limits.Meanwhile, spot Bitcoin exchange-traded funds recorded US$517 million in single-day net inflows during the market recovery.
Institutional buyers have not stepped back. Strategy, the company led by Michael Saylor, now holds 840,447 BTC; its average cost per coin sits at $75,653, meaning the firm is back in profit territory after this move.Crypto-related equities joined the surge, pushing Strategy (NASDAQ:MSTR) up nearly 12 percent, while Coinbase Global (NASDAQ:COIN) gained roughly 10 percent.
Technical Analysis: Moving Averages vs. Overbought RSI
The daily chart backs up the bullish case, at least in the short term.BTC has broken above its 20, 50, and 100-day EMAs, which sit at $66,441, $65,362, and $66,738.It also cleared the 200 EMA near $71,577, a level that had capped price for weeks.When price sits above all major EMAs, it usually means buyers are in control.
But there’s a catch.The RSI reading is 85.67, which is deep in overbought territory.Above 70 is typically considered stretched, and a reading near 86 suggests the move may be running hot, meaning some cooling off would not be surprising.
Resistance and Support Levels to Watch
For short-term trading, the technical levels are clearly mapped out:
- Immediate Resistance ($78,000–$80,000): The current battle zone for bulls.
- Next Resistance ($82,500): Confirms continuation if closed above.
- Extended Target ($85,000): Possible if $82,500 flips to support.
- First Support ($75,000): First line of defense on a pullback.
- Major Support ($71,577): The 200 EMA. Losing this weakens the bullish case and could bring sellers back in.
Traders watching bitcoin price news should keep an eye on whether BTC can hold above $75,000 on any dip, as that would keep the broader structure intact heading into the next test at $80,000.
Altcoin Market Momentum
Digital assets broke out of a months-long slump alongside Bitcoin.Ether climbed above US$2,200 and Ethereum (ETH) was priced at US$2,402.78, trading 5.1 percent higher over the last 24 hours.XRP jumped 25 percent to US$1.42, and Solana (SOL) traded at US$91.64, a rise of 5 percent.
10-Day Bitcoin Price Prediction: Consensus Forecast and Averages
For traders looking at the immediate window, algorithmic models and technical forecasts paint a picture of near-term consolidation following the recent breakout. Based on an average of current momentum and volatility models, Bitcoin is projected to trade in a tight range over the next 10 days.
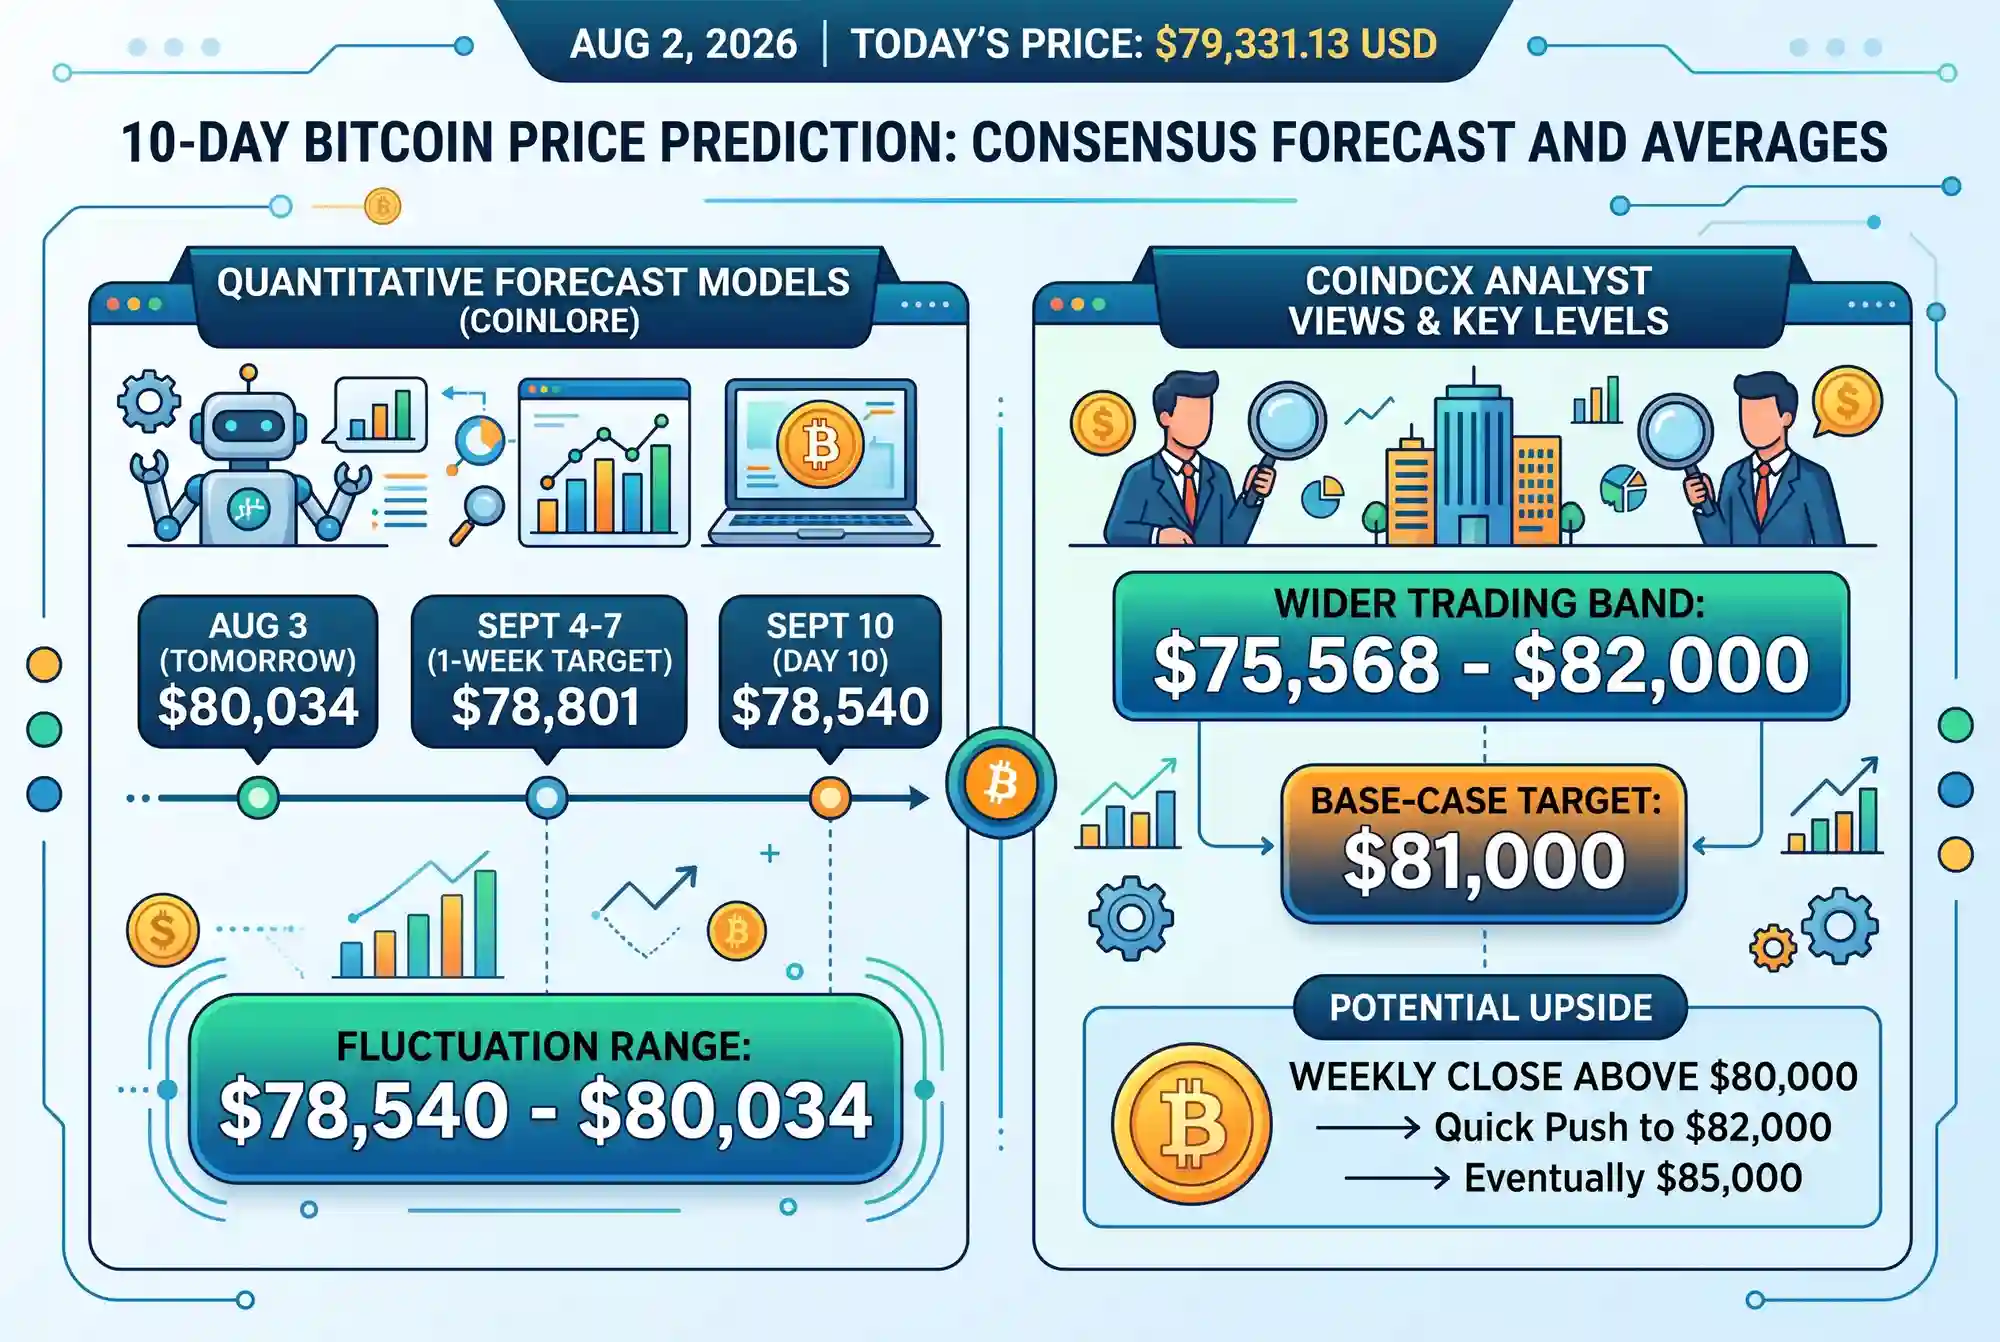
Quantitative Forecast Models
Algorithmic projections from CoinLore indicate that over the next 10 days, Bitcoin is expected to fluctuate between $78,540 and $80,034. Daily tracking models suggest a slight cooling period headed into early September 2026:
- Tomorrow Forecast: $80,034
- 1-Week Target (Sept 4-7, 2026):Drifting toward $78,801
- Day 10 (Sept 10, 2026):$78,540
Meanwhile, analysts at CoinDCX offer a slightly wider 7-to-10-day trading band of $75,568 to $82,000, with a base-case target resting at $81,000.If Bitcoin can secure a confirmed weekly close above the $80,000 threshold, it opens the door for a quick push to $82,000 and eventually $85,000.
The Averages and Technical Consensus
By averaging these quantitative and technical models, the consensus 10-day price prediction lands at approximately $79,800 to $81,000, provided major support holds.
However, technical indicators are flashing warning signs of a temporary plateau. The 14-day Relative Strength Index (RSI) is currently hovering around 79.80 to 80.61, indicating deeply “Overbought” conditions.Furthermore, the MACD (Moving Average Convergence Divergence) histogram is positive but contracting from its peak.
According to market analysts, this divergence between price and momentum is the clearest caution the rally has produced. Because both the RSI is easing and the MACD is narrowing, the most likely near-term path for the next 10 days is sideways consolidation.This pause would allow the underlying moving averages—specifically the critical 200-day EMA at $71,901—to catch up to the current price action before the next major leg up.
10-Day Altcoin Prices Prediction: Consensus Forecast and Averages
Altcoin Market Momentum and Fear & Greed
Among major altcoins, BNB, XRP, Solana, Tron, Hyperliquid, Dogecoin and Cardano have rallied by as much as 51%. The Fear & Greed Index has also moved into “Extreme Greed” for the first time since November 2024, supported by a reading of 71 (Greed), signalling stronger risk appetite.
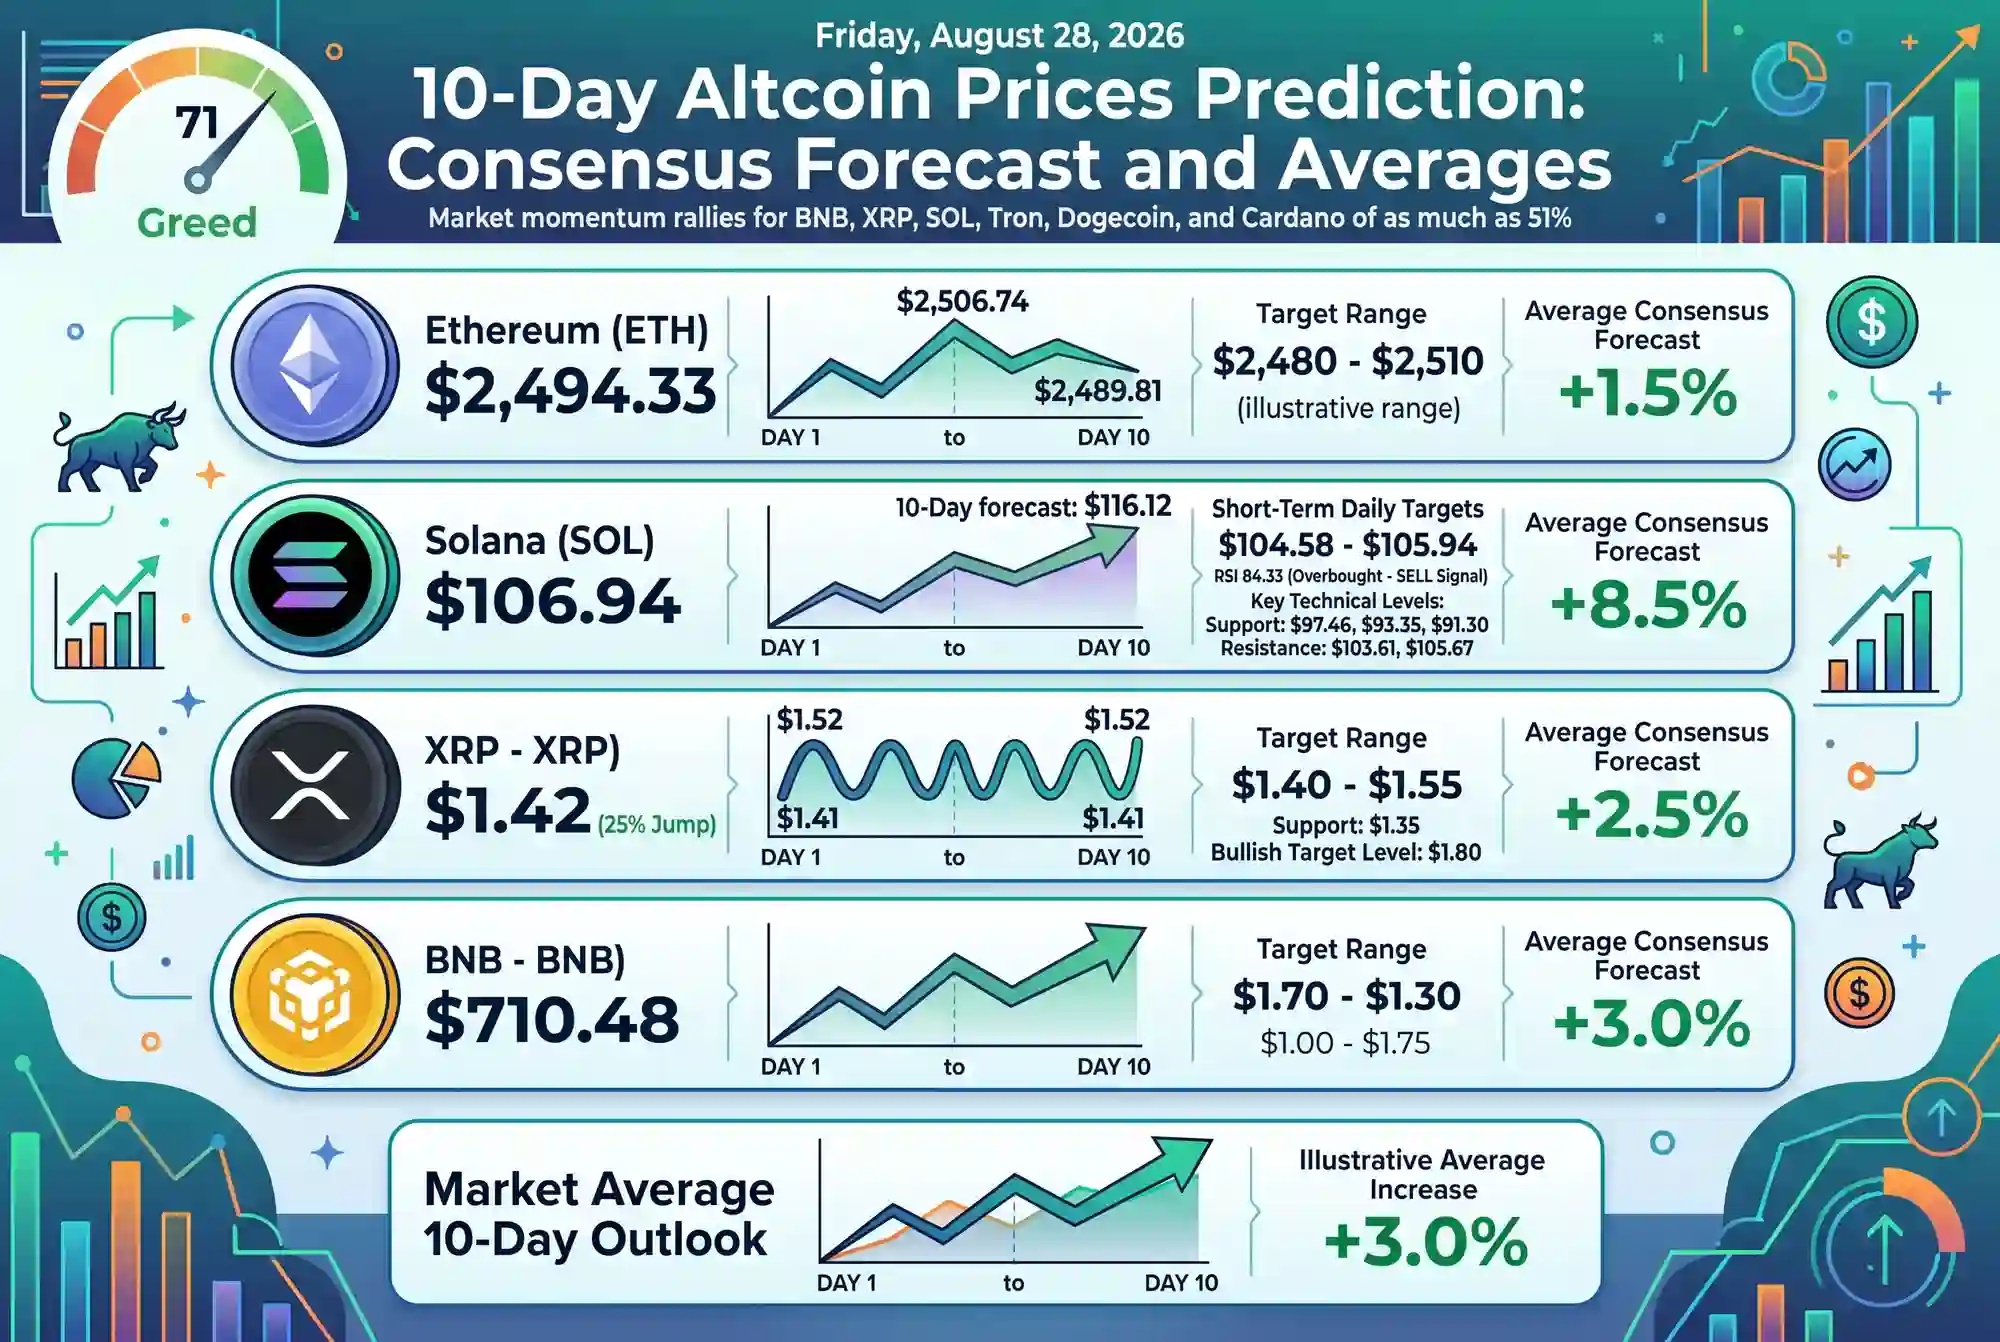
Ethereum (ETH) 10-Day Projections
Over the past week, Ethereum has gained 32% to trade at around $2,501. The 10-day exchange rate forecast data shows the absolute value of ETH continuing to fluctuate heavily, reaching $2,506.74 before consolidating near the $2,489.81 level headed into late August 2026.
Solana (SOL) Forecast and Technical Consensus
The Solana price prediction for the next 10 days suggests a move toward $116.12, with technical consensus showing the value is forecasted to increase and hit $117.09 by late September 2026. Short-term daily Solana price targets project a steady climb from $104.58 up to $105.94 over the final days of August.
However, technical analysis shows a neutral market outlook. The 14-Day RSI sits at 84.33 (Overbought), triggering a “SELL” action on technical oscillators. Based on today’s classical pivot point, Solana has support levels of $97.46, $93.35, and the strongest at $91.30, while facing resistance levels at $103.61 and $105.67.
XRP Targets and Support Levels
XRP jumped 25 percent to US$1.42. The 10-day snapshot forecasts absolute values oscillating between $1.41 and a peak of $1.52. Market reports indicate that the $1.35 support holds as bulls target $1.80, while aggressive speculative market news reveals some XRP price predictions targeting as high as $6.40 following early presale round sellouts.
Sources Quoted:
- CoinGabbar (Lokesh Gupta, Aug 21, 2026) – Technical levels, short squeeze statistics ($822M 24hr / $3B total), and EMA/RSI data.
- CaptainAltcoin (Aug 27, 2026) – Data on BTC hitting a 3-month high above $81,000 after 2026’s sharpest short squeeze.
- Bitcoin Foundation (Aug 26, 2026) – Details on President Trump pushing the Senate for the CLARITY Act and the specific legislative provisions.
- Investing News Network (INN) (Aug 21, 2026) – Macroeconomic updates regarding Treasury Secretary Scott Bessent, the $517M ETF inflows, and altcoin price data.
- CoinDCX (Aug 27, 2026) – Extracted the 7-day price bands ($75,568–$82,000), base target of $81,000, and MACD/RSI divergence data.
- CoinLore (Aug 27, 2026) – Extracted the algorithmic 10-day price prediction range ($78,540–$80,034) and day-by-day forecast targets for early September 2026.
- Economic Times (Aug 25, 2026) – Altcoin rally percentages, Ethereum 32% gain data, and Extreme Greed Index sentiment.
- CoinLore & CoinCheckup (Aug 28, 2026) – Solana 10-day price predictions ($116.12 to $117.09), daily short-term targets ($104.58 – $105.94), and RSI/Pivot Point technical data.
- Markets Insider & Exchange Data (Aug 27-28, 2026) – XRP 10-day absolute value forecasts ($1.41-$1.52), $1.35 support levels, and $6.40 aggressive targets.
Max Newman is Deputy Editor and Data Strategy at Virlan.