

BTC Breakout Reasons: Why is Crypto Going Up Today?
Bitcoin jumped by roughly 6% earlier today as a surprise expansion of US Treasury bond buybacks sent yields lower and boosted demand for risk assets.
The catalyst for that move appears to have been an announcement on behalf of the US Treasury Department, which will be doubling (at least) the maximum size of liquidity-support buybacks for longer-dated government debt, raising them from $2 billion to at least $4 billion per operation. The 30-year Treasury yield touched 5.34% on Tuesday, which was its highest level since 2007.
This came amid persistent inflation concerns, heavy government borrowing, and worries about the overall US fiscal outlook. The market’s reaction was immediate.
The 30-year yield dropped toward 5.20%, while the 10-year yield also moved lower. This prompted a move in stocks, gold, and crypto, all of which moved up, while the dollar weakened. Lower bond yields can make non-yielding and riskier assets relatively more attractive.
The US Treasury Buybacks Crypto Catalyst
The broader market is turning risk-on due to softer treasury yields, a weaker US dollar, and renewed US spot Bitcoin ETF inflows… ETFs attracted over $651 million in fresh capital over three sessions, signaling renewed institutional demand. Regulatory and infrastructure clarity: Post-MiCA frameworks and clearer licensing regimes are reducing uncertainty for institutional investors, while real-world asset tokenisation moves towards scale. In the US, the CLARITY Act remains the largest single catalyst on the calendar.
Technical Analysis: Bitcoin 200 EMA Breakout & Strategy BTC Breakeven
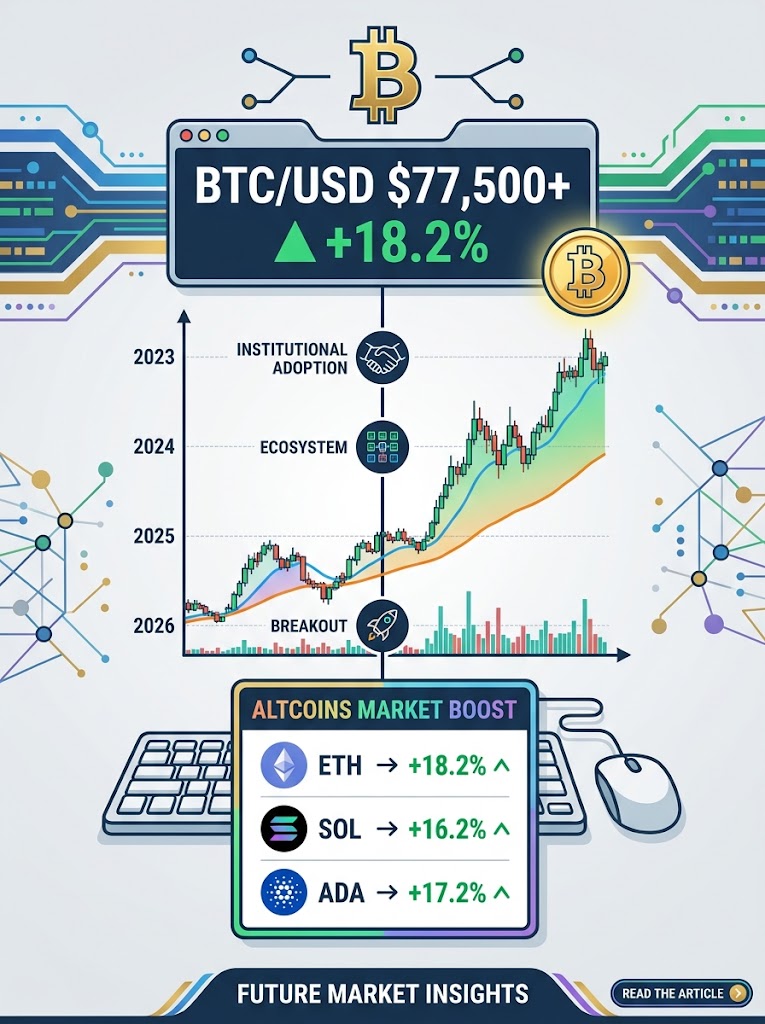
Bitcoin (BTC) hit $77,000 on Friday as business intelligence company Strategy’s corporate treasury returned to profit. Data from TradingView showed new local highs above $77,400 prior to the week’s final Wall Street open.
Now up around 20% in 48 hours, BTCUSD saw little by way of consolidation as it reclaimed a key level for Strategy, the world’s largest corporate Bitcoin treasury company. Data from monitoring resource BitcoinTreasuries puts the cost basis for Strategy’s holdings of 840,447 BTC at $75,385, currently with a year-to-date gain of approximately $450 million. BTCUSD broke through several key resistance levels this week, including its 200-day simple moving average (SMA) at $68,967, a key target to reclaim to end the long-term BTC price downtrend.
Amid misgivings over the durability of Bitcoin’s volatile upside move, analysis from onchain analytics platform Glassnode revealed a new safety net forming below $70,000. Some 3.44 million BTC now have an onchain cost basis, also known as realized price, between $58,000 and $67,000.
The overall market structure screams uptrend: price is higher, the intermediate support levels are stacked closely below, and the dominant trendline at $65,784.25 remains intact and ascending.
Across the ten major technical indicators, the weight of evidence is heavily bullish. The RSI at 77.3 confirms strong upside momentum without showing divergence… All four key exponential moving averages are stacked in bullish order, with price trading above each of them. When the Bollinger Bands widen like this and price holds in the upper band zone, it typically precedes further upside as the bands themselves become the next resistance target.
Altcoin Season 2026: Is Capital Rotating?
In 2026, expectations of an altseason have turned into a prolonged period of uncertainty for many market participants. Bitcoin continues to hold the bulk of the capital, altcoin growth is concentrated in specific tokens and sectors.
In 2026, bitcoin continues to lead the broader crypto market structure while altcoins rotate through short-lived, narrative-driven rallies. Bitcoin’s dominance of the market stands at an astonishing 56%. Prediction-market trading volume has exploded higher, and a number of altcoins remain the focus of rampant speculation. The Altcoin Season Index, however, reads 35 and remains firmly in Bitcoin Season territory. A reading of 75 or higher signals altcoin season, while a reading of 25 or lower signals Bitcoin season.
Market Dynamics & The ETF Wall
The current market cycle differs from previous ones because of the so-called ETF Wall. Spot Bitcoin ETFs launched by asset managers such as BlackRock and Fidelity have attracted billions of dollars from institutional investors.
Unlike crypto traders, these investors usually gain exposure only to Bitcoin through regulated financial products, leaving that capital effectively locked inside the BTC ecosystem. In 2026, a broad altseason may require both Bitcoin profit-taking and a fresh wave of retail and on-chain liquidity before capital can spread across the wider market.
If Bitcoin begins to stall while the broader market improves, the strongest altcoins could be among the first to move. Michaël van de Poppe sees Ethereum ETHUSD and Solana SOLUSD as key names to watch, saying strong altcoins could break higher once Bitcoin pauses. The U.S. ISM manufacturing index could be one of the most important signs for the next altcoin cycle.
Historically, stronger manufacturing activity has coincided with altcoins outperforming Bitcoin. The crucial level is 58… The House of Crypto also points to September–October as a potential altcoin window if the ISM manufacturing index reaches 58.
Bitcoin Price Prediction 2026: Expert Scenarios
All four key exponential moving averages are stacked in bullish order, with price trading above each of them… technical analysts noted that BTC closed above its 200-day EMA… setting the stage for a short squeeze toward $80K. Fidelity and Galaxy Digital… driven by fixed supply mechanics, ETF absorption, and dovish monetary easing… The next crypto bull market will almost certainly be fueled by a combination of improved liquidity conditions, renewed institutional demand, regulatory clarity, and increased adoption of various blockchain applications.
The Federal Reserve does not meet in August, but traders will spend the month pricing its next decision on September 16. Two reports in August could decide whether that hike happens. The jobs report on August 7 will show whether the economy is cooling, and July’s inflation reading on August 12 will show whether prices are still climbing.
A separate expert lays out two Bitcoin price scenarios: a rally toward $68,000–$73,000, or a pullback to $60,500–$61,000… Bitcoin could fall to the $55,000 to $58,000 range if inflation comes in hot and a September hike looks close to certain.
Leo Falsafi is a digital marketing veteran and senior journalist at Virlan.co, where he covers the intersection of digital marketing, gaming, and breaking US trending news. With nearly two decades of hands-on experience in SEO and digital strategy, Leo has consulted for and scaled hundreds of companies. His deep industry roots allow him to deliver sharp, fact-checked insights and analysis on the trends shaping today's digital landscape.